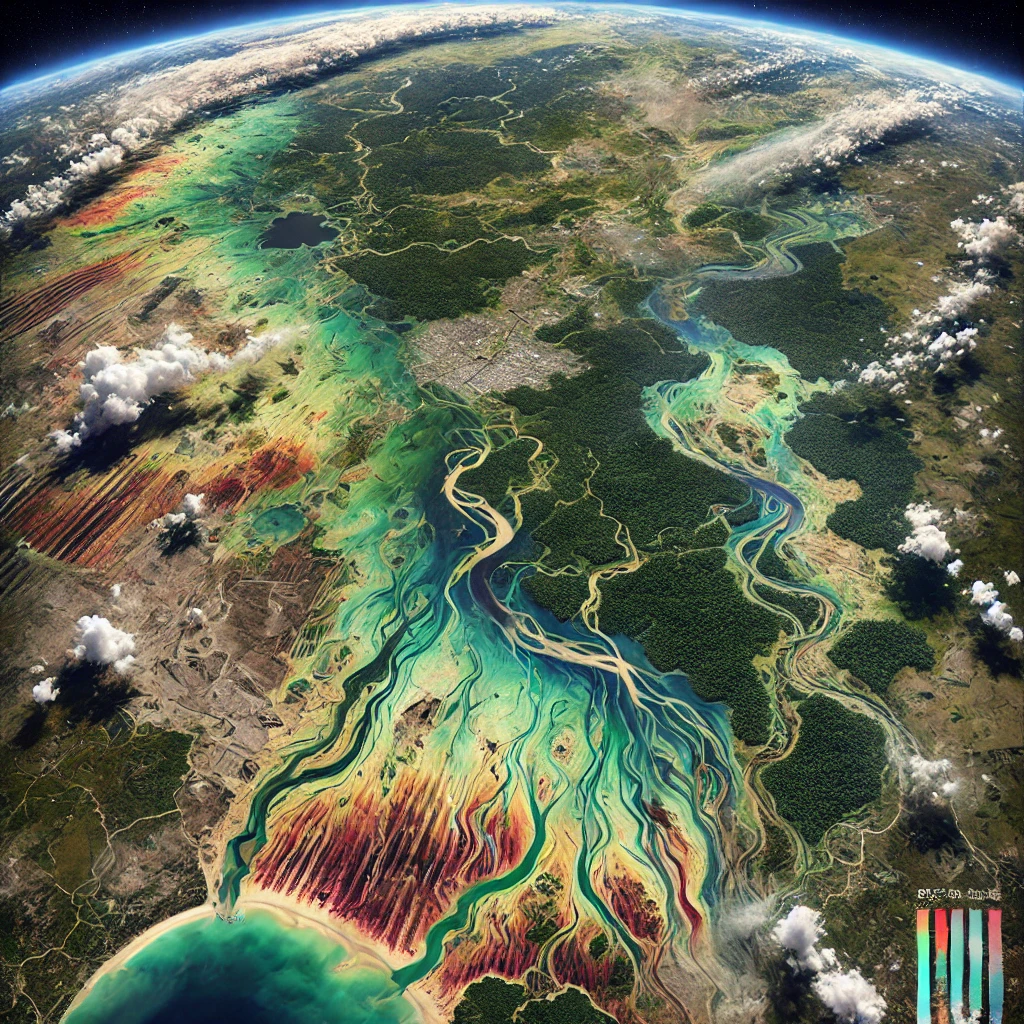
Geographic Information Systems (GIS) have emerged as a powerful tool in the fight against the UHI effect. By providing detailed spatial data, GIS allows city planners, environmental scientists, and policymakers to visualize, analyze, and address the factors contributing to urban heat. This article will explore how GIS technology can be leveraged to tackle the UHI effect, offering innovative solutions for creating cooler, more sustainable cities.
Understanding the Urban Heat Island Effect
Before delving into the role of GIS, it’s essential to understand the underlying causes and impacts of the UHI effect. The UHI effect occurs due to a combination of factors:
- Surface Composition: Urban areas are covered with materials like concrete and asphalt, which absorb and retain heat more effectively than natural landscapes.
- Lack of Vegetation: The replacement of natural vegetation with buildings and roads reduces the cooling effects of shading and evapotranspiration, which help to cool the surrounding air.
- Waste Heat: The energy consumed in cities, especially from vehicles, industrial activities, and air conditioning, generates additional heat, exacerbating the UHI effect.
- Urban Geometry: The arrangement of buildings and streets can trap heat, reducing airflow and increasing the retention of heat within the urban environment.
These factors collectively contribute to higher temperatures in cities, particularly during the night when the heat absorbed during the day is released back into the environment. The UHI effect not only makes cities uncomfortable for residents but also contributes to greater energy demands for cooling, increased air pollution, and adverse health outcomes, particularly for vulnerable populations.
How GIS Can Help Mitigate the Urban Heat Island Effect
GIS is a technology that captures, stores, manipulates, analyzes, manages, and presents spatial or geographic data. When applied to the UHI effect, GIS can provide invaluable insights that help urban planners and policymakers develop strategies to mitigate the heat island effect. Below are several ways GIS can be utilized:
1. Mapping Urban Heat Islands
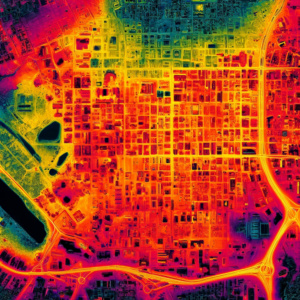
GIS allows for the creation of detailed maps that visualize temperature variations across a city. These maps, known as heat maps, are generated by collecting data from various sources such as satellite imagery, ground-based temperature sensors, and weather stations. The data is then processed to produce high-resolution maps that highlight areas of intense heat.
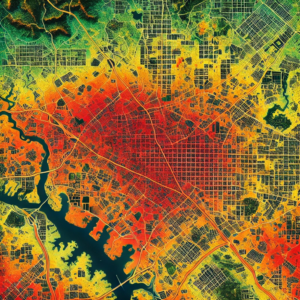
These heat maps are crucial for identifying hotspots within a city where temperatures are significantly higher than in surrounding areas. Once these hotspots are identified, targeted interventions can be implemented to reduce temperatures in these specific areas.
2. Identifying Contributing Factors
One of the strengths of GIS is its ability to integrate and analyze multiple layers of data. By overlaying different types of spatial data—such as land use, vegetation cover, building materials, and energy consumption—GIS can help identify the specific factors contributing to the UHI effect in different parts of the city.
For example, GIS can be used to analyze the relationship between land surface temperatures and the amount of impervious surfaces (e.g., roads, parking lots) in an area. This analysis can reveal the extent to which the lack of vegetation and the prevalence of heat-absorbing materials contribute to elevated temperatures.
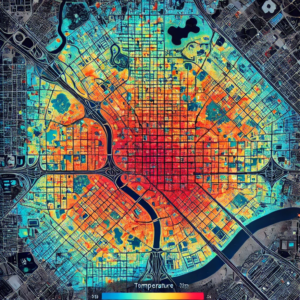
Understanding these contributing factors is essential for designing effective interventions, such as increasing green spaces or using reflective materials in construction to reduce heat absorption.
3. Planning and Implementing Green Infrastructure
One of the most effective ways to mitigate the UHI effect is through the implementation of green infrastructure, such as parks, green roofs, and tree-lined streets. GIS plays a critical role in planning and implementing these solutions by identifying suitable locations for green infrastructure and predicting their impact on urban temperatures.
GIS can be used to map existing green spaces and analyze their distribution across the city. This analysis helps identify areas that are underserved by green spaces and could benefit from new parks or tree planting initiatives. Additionally, GIS can model the potential cooling effects of proposed green infrastructure projects, allowing planners to prioritize interventions that will have the greatest impact.
Furthermore, GIS can be used to assess the connectivity of green spaces, ensuring that they form a network that maximizes their cooling effects and provides other ecological benefits, such as supporting biodiversity and reducing stormwater runoff.
4. Monitoring and Evaluating Mitigation Efforts
After interventions are implemented, it’s essential to monitor their effectiveness in reducing urban heat. GIS provides a platform for ongoing monitoring by integrating real-time data from temperature sensors, satellite imagery, and other sources. This data can be used to update heat maps and assess the impact of mitigation efforts over time.
For example, if a city plants trees in a neighborhood to reduce temperatures, GIS can be used to monitor changes in surface temperatures and compare them to pre-intervention levels. This evaluation helps determine whether the intervention is working as intended or if additional measures are needed.
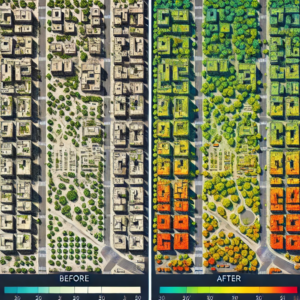
By providing a continuous feedback loop, GIS ensures that urban heat mitigation strategies remain effective and can be adjusted as needed to respond to changing conditions.
5. Supporting Public Awareness and Participation
Public awareness and participation are crucial for the success of urban heat mitigation efforts. GIS can be used to create interactive maps and tools that engage the public and encourage participation in UHI reduction initiatives.
For example, cities can use GIS-based platforms to allow residents to report areas that feel particularly hot, suggest locations for new green spaces, or participate in tree-planting programs. These platforms can also provide information about how individuals can reduce their personal contributions to the UHI effect, such as by using reflective roofing materials or planting trees on their property.
By involving the public in the process, cities can build support for UHI mitigation strategies and ensure that they are implemented in a way that meets the needs of the community.
Case Studies: GIS in Action Against Urban Heat
To illustrate the practical applications of GIS in combating the UHI effect, let’s explore a few case studies where GIS has been successfully used to reduce urban heat.
Case Study 1: New York City’s Cool Neighborhoods Program
New York City is one of the many urban areas where the UHI effect is a significant concern. In response, the city launched the Cool Neighborhoods NYC program, which aims to reduce heat-related risks through a combination of green infrastructure, cool roofs, and community engagement.
GIS played a key role in the development and implementation of this program. The city used GIS to identify neighborhoods most vulnerable to the UHI effect, based on factors such as temperature, land use, and the presence of vulnerable populations (e.g., elderly residents, low-income communities). These areas were prioritized for interventions such as tree planting, the installation of cool roofs, and the creation of new green spaces.
The GIS analysis also helped the city track the progress of the program and measure its impact on urban temperatures. Preliminary results showed that the targeted interventions led to a measurable reduction in surface temperatures, demonstrating the effectiveness of the program.
Case Study 2: Singapore’s Urban Redevelopment Authority (URA)
Singapore, a city-state known for its innovative urban planning, has been using GIS to combat the UHI effect as part of its broader efforts to create a sustainable and livable city. The Urban Redevelopment Authority (URA) uses GIS to integrate climate data into its planning processes, ensuring that new developments contribute to rather than exacerbate urban heat.
One of the key applications of GIS in Singapore is the identification of potential “urban heat traps”—areas where the combination of dense development, low vegetation cover, and specific building geometries leads to higher temperatures. By mapping these heat traps, the URA can implement targeted interventions such as increasing green spaces, optimizing building orientation, and using reflective materials in construction.
GIS is also used to simulate the cooling effects of different urban planning scenarios, helping the URA make informed decisions about land use and development. These simulations allow planners to test the impact of various interventions before they are implemented, ensuring that the most effective strategies are chosen.
Future Directions: Emerging GIS Technologies for UHI Mitigation
As GIS technology continues to evolve, new tools and techniques are emerging that can further enhance its effectiveness in tackling the UHI effect. Here are some of the most promising developments:
1. Integration with Remote Sensing Technologies
Remote sensing technologies, such as drones and high-resolution satellite imagery, are increasingly being integrated with GIS to provide even more detailed and accurate data on urban heat. Drones equipped with thermal cameras can capture temperature data at a fine scale, allowing for the creation of high-resolution heat maps that reveal small-scale variations in temperature within a city.
When combined with GIS, this data can be used to identify micro-level heat islands that may not be visible in traditional satellite imagery. This information is particularly useful for targeting interventions in specific areas, such as individual streets or neighborhoods, where the UHI effect is most severe.
2. Machine Learning and AI Integration
Machine learning and artificial intelligence (AI) are being integrated with GIS to enhance its analytical capabilities. These technologies can be used to analyze large datasets and identify patterns that may not be apparent through traditional methods. For example, machine learning algorithms can be trained to predict the impact of different urban planning scenarios on the UHI effect, helping planners choose the most effective interventions.
AI can also be used to automate the process of data collection and analysis, allowing for real-time monitoring of urban temperatures and the effectiveness of mitigation efforts. This automation reduces the time and resources needed to manage UHI mitigation programs and ensures that they can be scaled up to cover larger areas.
3. Citizen Science and Crowdsourcing
Citizen science and crowdsourcing initiatives are becoming increasingly popular as a way to collect data on urban heat and engage the public in mitigation efforts. By using mobile apps and online platforms, residents can contribute data on local temperatures, report areas that feel particularly hot, and suggest locations for green infrastructure.
This crowdsourced data can be integrated into GIS to create more accurate and comprehensive heat maps, reflecting the experiences of people living in the city. It also helps build public awareness of the UHI effect and encourages community participation in efforts to reduce urban heat.
Conclusion: GIS as a Critical Tool for Sustainable Urban Development
The Urban Heat Island effect is a complex challenge that requires a multifaceted approach to address. GIS technology offers a powerful solution by providing the tools needed to visualize, analyze, and mitigate the factors contributing to urban heat. Through the creation of detailed heat maps, the identification of contributing factors, the planning of green infrastructure, and the monitoring of mitigation efforts, GIS enables cities to develop targeted strategies that reduce the UHI effect and create more sustainable urban environments.
As GIS technology continues to evolve, it will play an increasingly important role in the fight against urban heat. By integrating new technologies such as remote sensing, machine learning, and citizen science, GIS can provide even more accurate and actionable insights, helping cities around the world create cooler, healthier, and more resilient urban spaces.
The future of urban planning lies in the ability to harness the power of spatial data to make informed decisions that benefit both people and the environment. GIS is at the forefront of this movement, offering the tools and techniques needed to tackle one of the most pressing challenges of our time: the Urban Heat Island effect.
Please note that all the images in this article are illustrations only.


